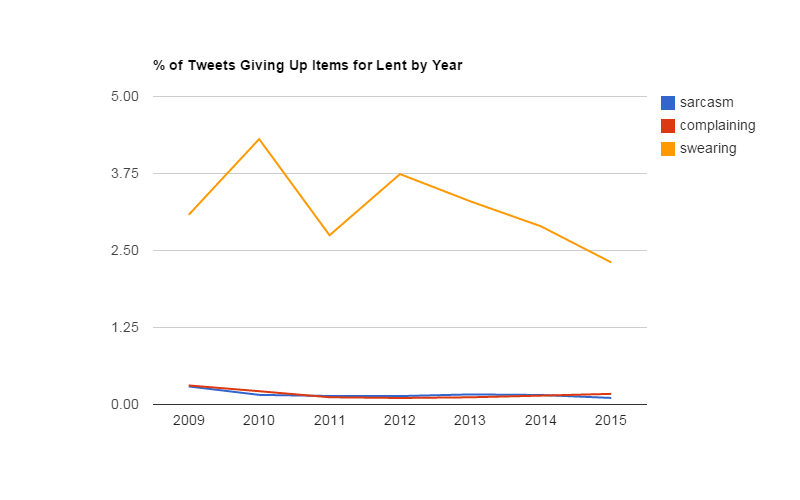
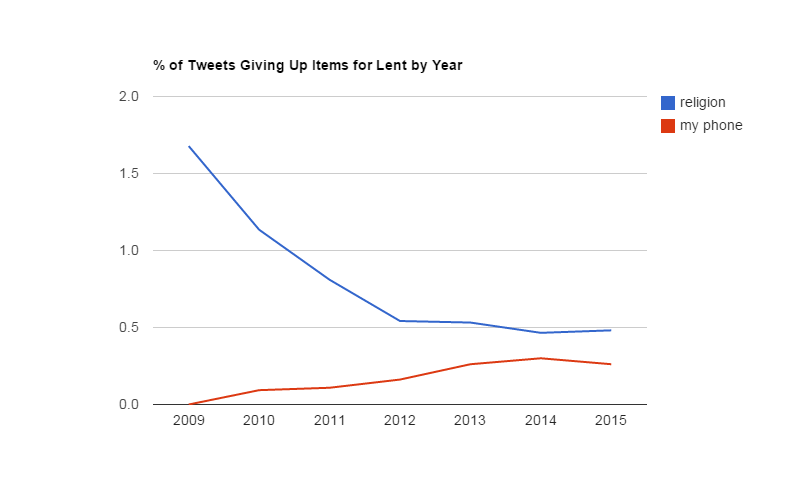
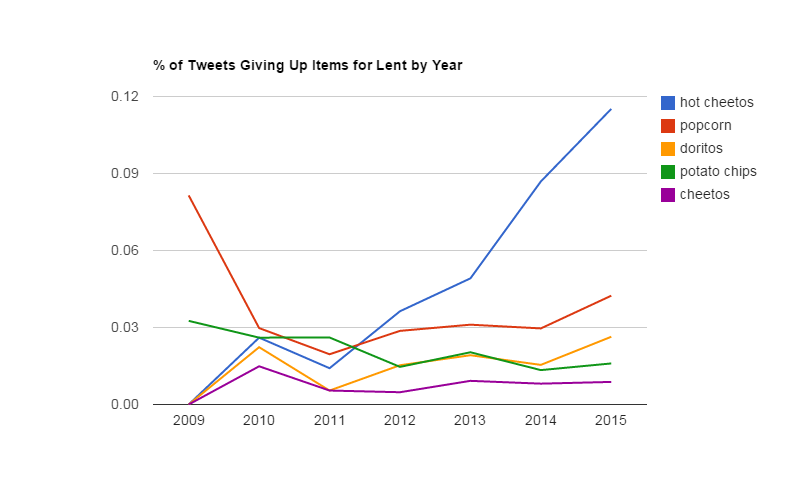
In this series
[Updated Feb. 23 with final total from Ash Wednesday week.]
Nearly one in five Americans observed Lent last year. This year, more than 400,000 tweeted about their fast.
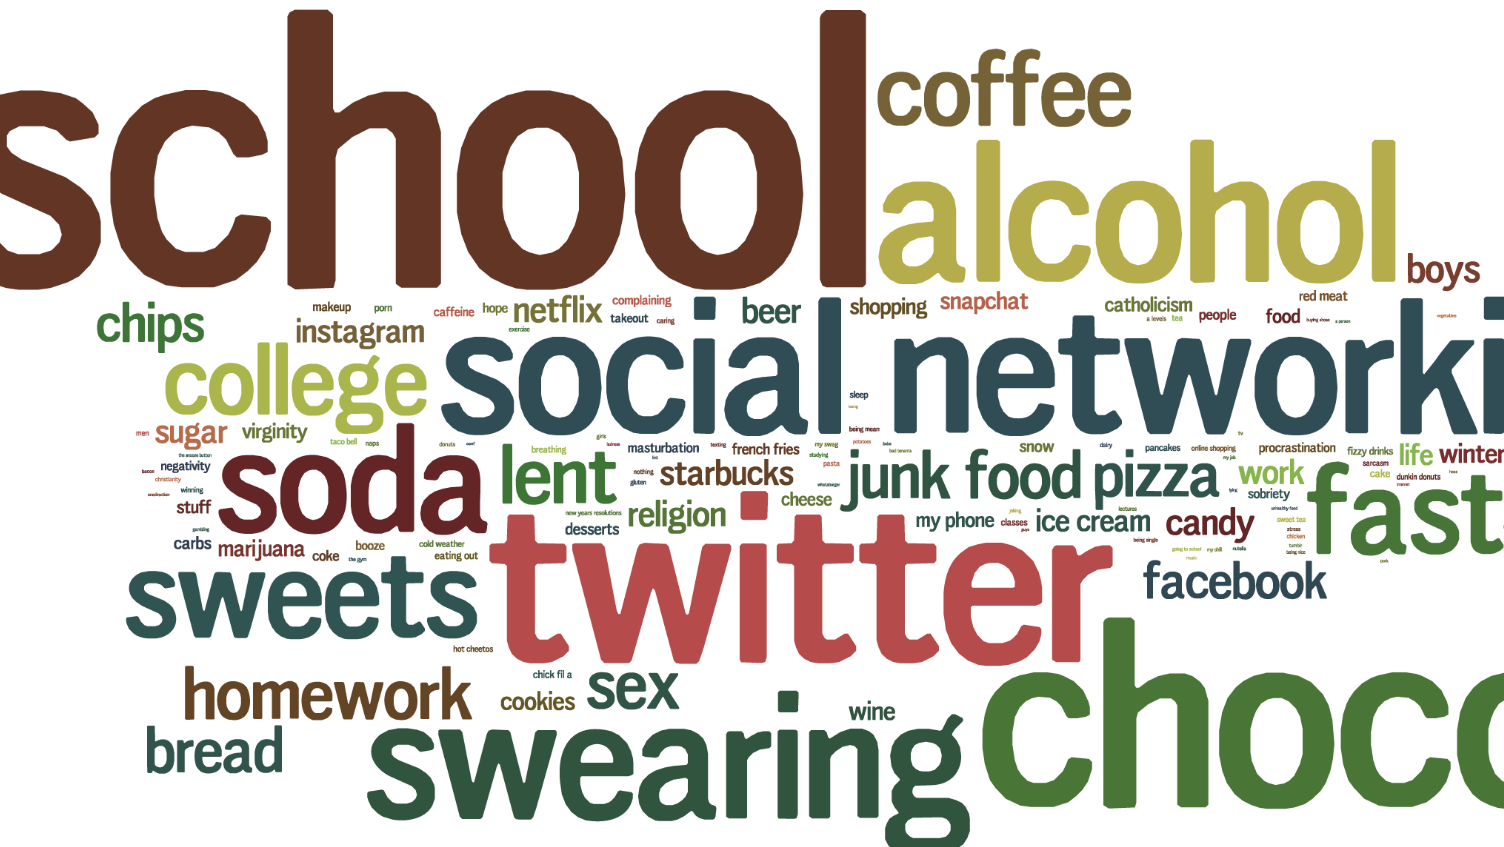
Food and technology remained the most popular categories that tweeting Americans reported giving up in 2015. The top five choices: School, chocolate, Twitter, alcohol, and social networking—ideas consistently popular for Christians since Smith began using Twitter’s API to track Lent in 2009. [The final 2015 tally is below.]
"My hypothesis last year was that 'school' was so high because Ash Wednesday coincided with spring break at many schools, but that isn’t the case this year. In the UK, A-Level exams are coming up at the beginning of March, so that may be part of it," wrote Stephen Smith of OpenBible.info who tracks hundreds of thousands of Lenten tweets during the week of Ash Wednesday.
Smith also reported on how retweets affected his Lent tracker. While the top 15 terms are largely similar to the original list, college jumps nine spots to No. 2, and Obama jumps 61 spots to No. 9. [The full list is below.]
Overall, the number of tweets fell sharply from last year. In 2014, roughly 646,000 tweets were published during the week of Ash Wednesday compared to the 409,000 in 2015.
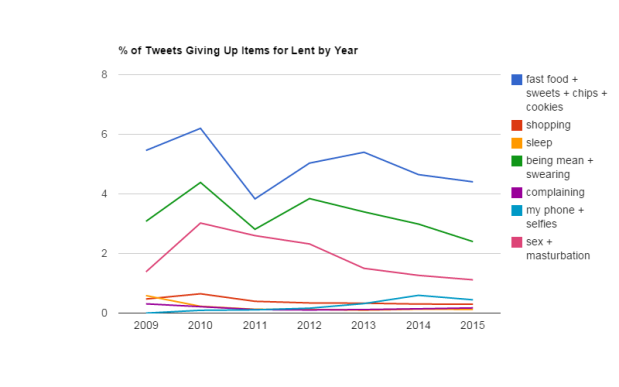
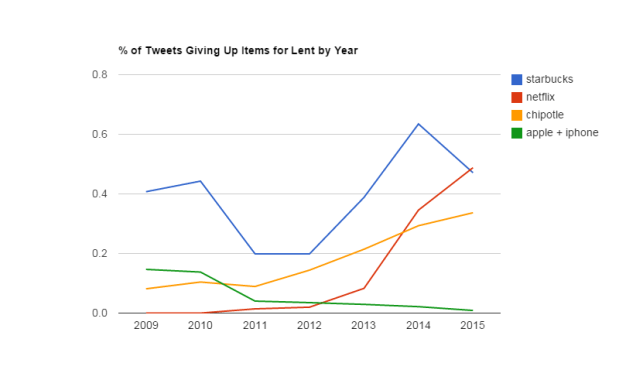
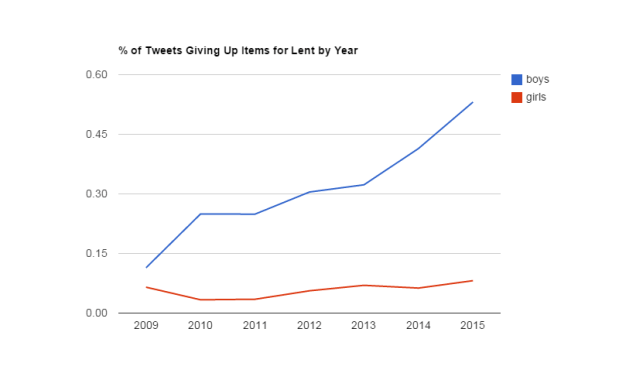
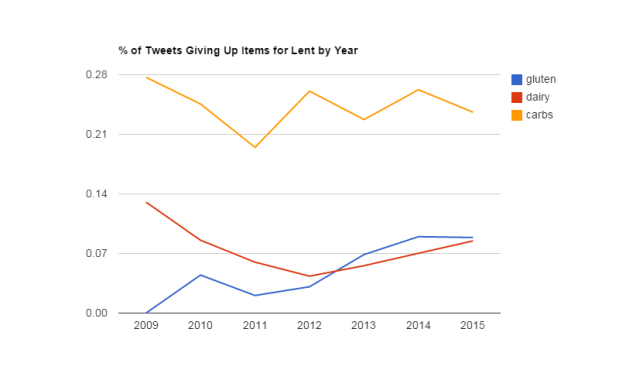
Current events and pop culture are sometimes reflected in Lenten tweets, though Smith noted his surprise that given last week's harsh winter weather, "weather-related tweets aren’t more popular."
"As a category, they move up one place from last year (to #12 from #13), though individually 'snow' moves up eight places and 'cold weather' moves up 79 places," he wrote.
In 2014, rapper Lil Boosie was released from prison during the week of Ash Wednesday, leading people to joke that he had given up prison for Lent. (The hip-hop artist came in at No. 51.) In 2013, after Pope Benedict announced he leaving the papacy, some wrote he was abstaining from “being pope.” (This phrase ranked No. 1.)
One thing people don't give up: Bible verses. Bible Gateway told CT that Lent is its busiest season of the year, with traffic between Ash Wednesday and Easter clocking in at 15 percent higher than the rest of 2014. Searches relating to dust and fasting increased 1000 percent and 500 percent respectively on the days surrounding Ash Wednesday. Searches for repentance increased by 50 percent on Ash Wednesday.
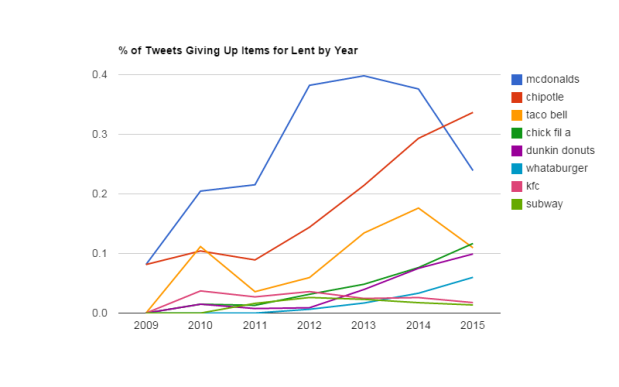
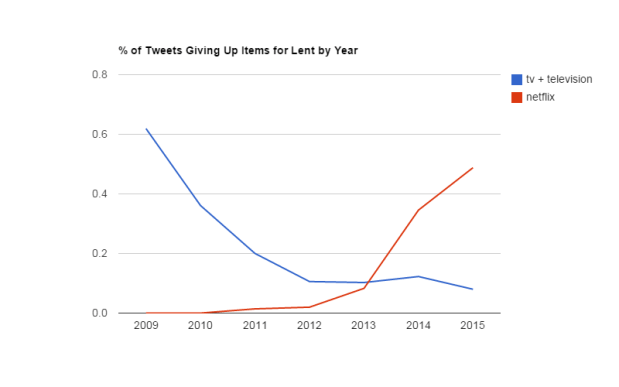
Of the 17 percent of Americans that observe Lent, the majority are practicing Catholics (63%) compared to 16 percent of practicing Protestants, according to a 2014 report by the Barna Group. People born in 1945 or earlier are most likely to fast (26%), and people born between 1946 and 1964 are least likely (10%). About 20 percent of young adults between the ages of 18 and 30 say they will fast.
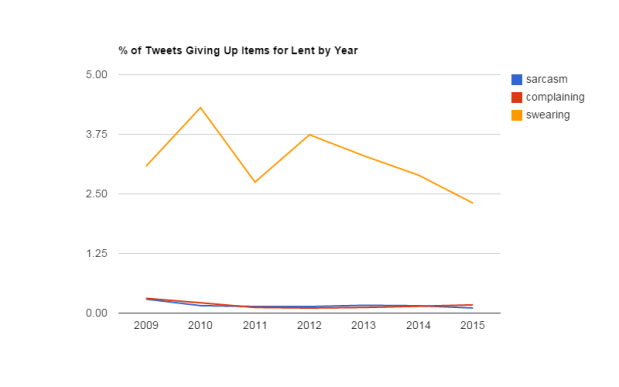
Twitter users giving up technology join 48 percent of practicing Protestants in the endeavor, according to Barna. Last year, people planned to fast from social networks (16%), smartphones (13%), television (11%), video games (10%), and the Internet (9%).
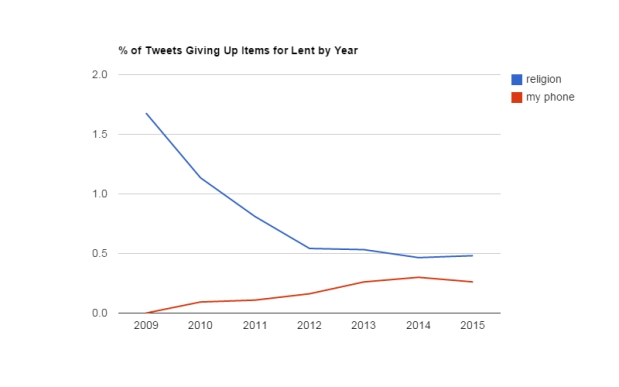
Among all Lent fasters—including those not on Twitter—food is still the most popular thing to sacrifice. Ninety-six percent of fasting Protestants and 89 percent of fasting Catholics are giving up some food item. The overall breakdown includes chocolate (30%), meat (28%), soda (26%) and alcohol (24%).
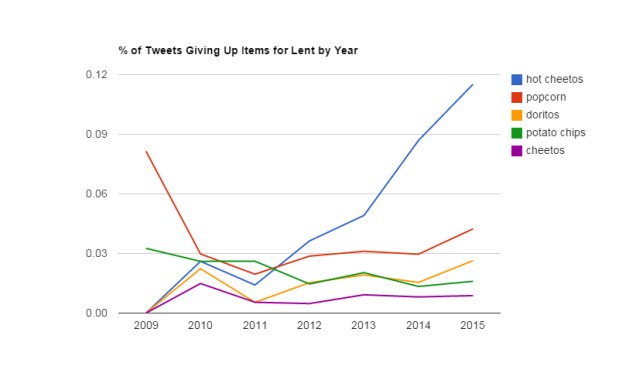
CT regularly reports on Lent, including three views on why bother celebrating Lent, what neuroscience tells us about Lent, Lent in Narnia, and the argument for lengthening Lent.
Here are the top things given up in 2014, 2013, 2012, and 2011.
Here is Smith's final total of the top 100 most-mentioned Lenten sacrifices (both serious and cynical) in 2015:
| Rank | Word | Count |
| 1 | School | 6,281 |
| 2 | Chocolate | 4,293 |
| 3 | 3,876 | |
| 4 | Alcohol | 3,216 |
| 5 | Social networking | 3,090 |
| 6 | Swearing | 2,887 |
| 7 | Soda | 2,473 |
| 8 | Sweets | 2,122 |
| 9 | Fast food | 2,056 |
| 10 | Coffee | 1,706 |
| 11 | College | 1,631 |
| 12 | F***boys | 1,527 |
| 13 | You | 1,462 |
| 14 | Lent | 1,348 |
| 15 | Meat | 1,335 |
| 16 | Homework | 1,208 |
| 17 | Sex | 1,165 |
| 18 | Junk food | 1,112 |
| 19 | Pizza | 1,067 |
| 20 | Bread | 1,060 |
| 21 | Chips | 905 |
| 22 | 853 | |
| 23 | Boys | 665 |
| 24 | Candy | 625 |
| 25 | Netflix | 610 |
| 26 | Religion | 602 |
| 27 | Beer | 596 |
| 28 | Starbucks | 591 |
| 29 | Work | 575 |
| 30 | Sugar | 565 |
| 31 | 554 | |
| 32 | Ice cream | 520 |
| 33 | Life | 489 |
| 34 | Winter | 454 |
| 35 | Smoking | 441 |
| 36 | Wine | 435 |
| 37 | Me | 434 |
| 38 | Cookies | 430 |
| 39 | Chipotle | 422 |
| 40 | Snapchat | 408 |
| 41 | Feelings | 393 |
| 42 | Marijuana | 381 |
| 43 | Shopping | 374 |
| 44 | Rice | 357 |
| 45 | My phone | 351 |
| 45 | Virginity | 351 |
| 46 | Catholicism | 337 |
| 47 | Food | 329 |
| 48 | Cheese | 315 |
| 49 | Stuff | 307 |
| 50 | McDonald’s | 300 |
| 51 | Carbs | 295 |
| 52 | Snow | 284 |
| 53 | Desserts | 276 |
| 54 | French fries | 257 |
| 55 | People | 248 |
| 56 | Coke | 245 |
| 57 | Fried food | 242 |
| 58 | Red meat | 237 |
| 59 | Masturbation | 233 |
| 60 | Selfies | 230 |
| 61 | Hope | 224 |
| 61 | Sobriety | 224 |
| 62 | Procrastination | 219 |
| 63 | Complaining | 216 |
| 64 | Makeup | 214 |
| 64 | Caffeine | 214 |
| 65 | Booze | 211 |
| 65 | Negativity | 211 |
| 66 | Takeout | 210 |
| 67 | Eating out | 184 |
| 68 | Cake | 183 |
| 69 | Chick Fil A | 179 |
| 70 | Obama | 178 |
| 71 | Fizzy drinks | 175 |
| 72 | Porn | 173 |
| 73 | Diet Coke | 172 |
| 74 | Pancakes | 159 |
| 75 | Breathing | 158 |
| 76 | Classes | 157 |
| 77 | Sleep | 156 |
| 78 | Peanut butter | 152 |
| 79 | Cold weather | 151 |
| 80 | Hot Cheetos | 145 |
| 81 | Liquor | 144 |
| 82 | Tea | 143 |
| 83 | Dunkin Donuts | 138 |
| 84 | Taco Bell | 137 |
| 85 | Men | 135 |
| 86 | Sarcasm | 133 |
| 87 | Winning | 127 |
| 88 | Online shopping | 126 |
| 89 | Sweet tea | 125 |
| 90 | Caring | 124 |
| 91 | Pasta | 123 |
| 92 | Naps | 122 |
| 93 | Juice | 117 |
| 94 | Nothing | 115 |
| 94 | A levels | 115 |
| 94 | Being mean | 115 |
| 95 | Him | 113 |
| 96 | New Year’s resolutions | 112 |
| 97 | My swag | 111 |
| 97 | Gluten | 111 |
| 98 | Exercise | 110 |
| 98 | Church | 110 |
| 99 | My boyfriend | 109 |
| 100 | Dairy | 106 |
2015 total including retweets (final):
| Rank | Word | Count | Difference from non-retweet rank |
| 1 | School | 38,532 | 0 |
| 2 | College | 17,615 | 9 |
| 3 | F***boys | 6,461 | 9 |
| 4 | Chocolate | 5,127 | -2 |
| 5 | 5,074 | -2 | |
| 6 | Alcohol | 4,427 | -2 |
| 7 | Social networking | 3,968 | -2 |
| 8 | Swearing | 3,534 | -2 |
| 9 | Obama | 3,351 | 61 |
| 10 | You | 2,940 | 3 |
| 11 | Soda | 2,820 | -4 |
| 12 | Coffee | 2,506 | -2 |
| 13 | Sweets | 2,499 | -5 |
| 14 | Homework | 2,456 | 2 |
| 15 | Fast food | 2,356 | -6 |
2014 total (final):
| Rank | Word | Count |
| 1 | School | 11,757 |
| 2 | Chocolate | 9,515 |
| 3 | 8,642 | |
| 4 | Swearing | 7,132 |
| 5 | Alcohol | 6,325 |
| 6 | Soda | 5,446 |
| 7 | Social networking | 4,197 |
| 8 | Sweets | 4,188 |
| 9 | Fast food | 4,088 |
| 10 | Lent | 2,842 |
| 11 | Meat | 2,790 |
| 12 | Homework | 2,760 |
| 13 | Junk food | 2,723 |
| 14 | Coffee | 2,678 |
| 15 | Sex | 2,392 |
| 16 | Chips | 2,129 |
| 17 | Bread | 2,020 |
| 18 | You | 2,016 |
| 19 | 1,926 | |
| 20 | Pizza | 1,628 |
| 21 | Starbucks | 1,566 |
| 22 | Candy | 1,412 |
| 23 | 1,212 | |
| 24 | Religion | 1,147 |
| 25 | Virginity | 1,143 |
| 26 | Cookies | 1,053 |
| 27 | Work | 1,031 |
| 28 | Ice cream | 1,025 |
| 29 | Boys | 1,021 |
| 30 | Marijuana | 1,018 |
| 31 | Smoking | 994 |
| 32 | Beer | 939 |
| 33 | Life | 933 |
| 34 | Food | 930 |
| 35 | McDonalds | 926 |
| 36 | Winter | 853 |
| 37 | Netflix | 851 |
| 38 | College | 819 |
| 39 | My phone | 777 |
| 40 | Shopping | 748 |
| 41 | Stuff | 733 |
| 42 | Selfies | 731 |
| 43 | Chipotle | 726 |
| 44 | Masturbation | 725 |
| 45 | Sugar | 682 |
| 46 | Cheese | 670 |
| 47 | Me | 656 |
| 48 | Sobriety | 655 |
| 49 | Wine | 652 |
| 50 | Carbs | 648 |
| 51 | Boosie | 581 |
| 52 | Fried food | 574 |
| 53 | Caffeine | 563 |
| 54 | Rice | 562 |
| 55 | Catholicism | 561 |
| 56 | Snapchat | 543 |
| 57 | Coke | 541 |
| 58 | Procrastination | 517 |
| 59 | People | 516 |
| 60 | Snow | 506 |
| 61 | Desserts | 486 |
| 62 | Fizzy drinks | 480 |
| 63 | French fries | 475 |
| 64 | Takeout | 464 |
| 65 | Obama | 452 |
| 66 | Makeup | 451 |
| 67 | Taco Bell | 434 |
| 68 | Feelings | 434 |
| 68 | Porn | 430 |
| 69 | Nothing | 427 |
| 70 | My swag | 420 |
| 71 | Negativity | 417 |
| 72 | Red meat | 396 |
| 73 | Diet Coke | 390 |
| 74 | Sarcasm | 380 |
| 75 | Breathing | 369 |
| 76 | Caring | 357 |
| 77 | Complaining | 354 |
| 78 | Tea | 352 |
| 79 | Pancakes | 340 |
| 80 | Peanut butter | 336 |
| 81 | Sweet tea | 335 |
| 82 | Booze | 325 |
| 83 | Sleep | 320 |
| 84 | Hope | 316 |
| 85 | Cake | 313 |
| 86 | Pasta | 303 |
| 87 | TV | 302 |
| 88 | Texting | 297 |
| 89 | Eating out | 275 |
| 90 | Exercise | 274 |
| 91 | Pants | 270 |
| 92 | Electricity | 268 |
| 93 | The gym | 258 |
| 94 | Liquor | 245 |
| 95 | Church | 243 |
| 96 | Tinder | 237 |
| 97 | Tumblr | 236 |
| 98 | Math | 236 |
| 98 | Juice | 232 |
| 99 | Being mean | 230 |
| 100 | Chick Fil A | 228 |
2015 top categories (final):
| Rank | Category | Tweets |
| 1 | food | 30,148 |
| 2 | school/work | 10,819 |
| 3 | technology | 9,277 |
| 4 | habits | 8,057 |
| 5 | smoking/drugs/alcohol | 6,230 |
| 6 | relationship | 4,229 |
| 7 | irony | 2,978 |
| 8 | sex | 2,274 |
| 9 | health/hygiene | 1,601 |
| 10 | religion | 1,470 |
| 11 | entertainment | 1,069 |
| 12 | weather | 986 |
| 13 | generic | 834 |
| 14 | shopping | 685 |
| 15 | sports | 410 |
| 16 | money | 276 |
| 17 | politics | 216 |
| 18 | clothes | 174 |
| 19 | celebrity | 165 |
| 20 | possessions | 83 |
2014 top categories (final):
| Rank | Category | Tweets |
| 1 | food | 62,453 |
| 2 | school/work | 18,148 |
| 3 | technology | 17,615 |
| 4 | habits | 16,616 |
| 5 | smoking/drugs/alcohol | 12,665 |
| 6 | irony | 7,319 |
| 7 | relationship | 6,563 |
| 8 | sex | 5,483 |
| 9 | health/hygiene | 3,476 |
| 10 | religion | 2,784 |
| 11 | generic | 2,504 |
| 12 | entertainment | 1,959 |
| 13 | weather | 1,496 |
| 14 | shopping | 1,183 |
| 15 | celebrity | 961 |
| 16 | sports | 780 |
| 17 | politics | 547 |
| 18 | clothes | 540 |
| 19 | money | 492 |
| 20 | habit | 393 |
| 21 | possessions | 217 |
| 22 | clothing | 62 |

