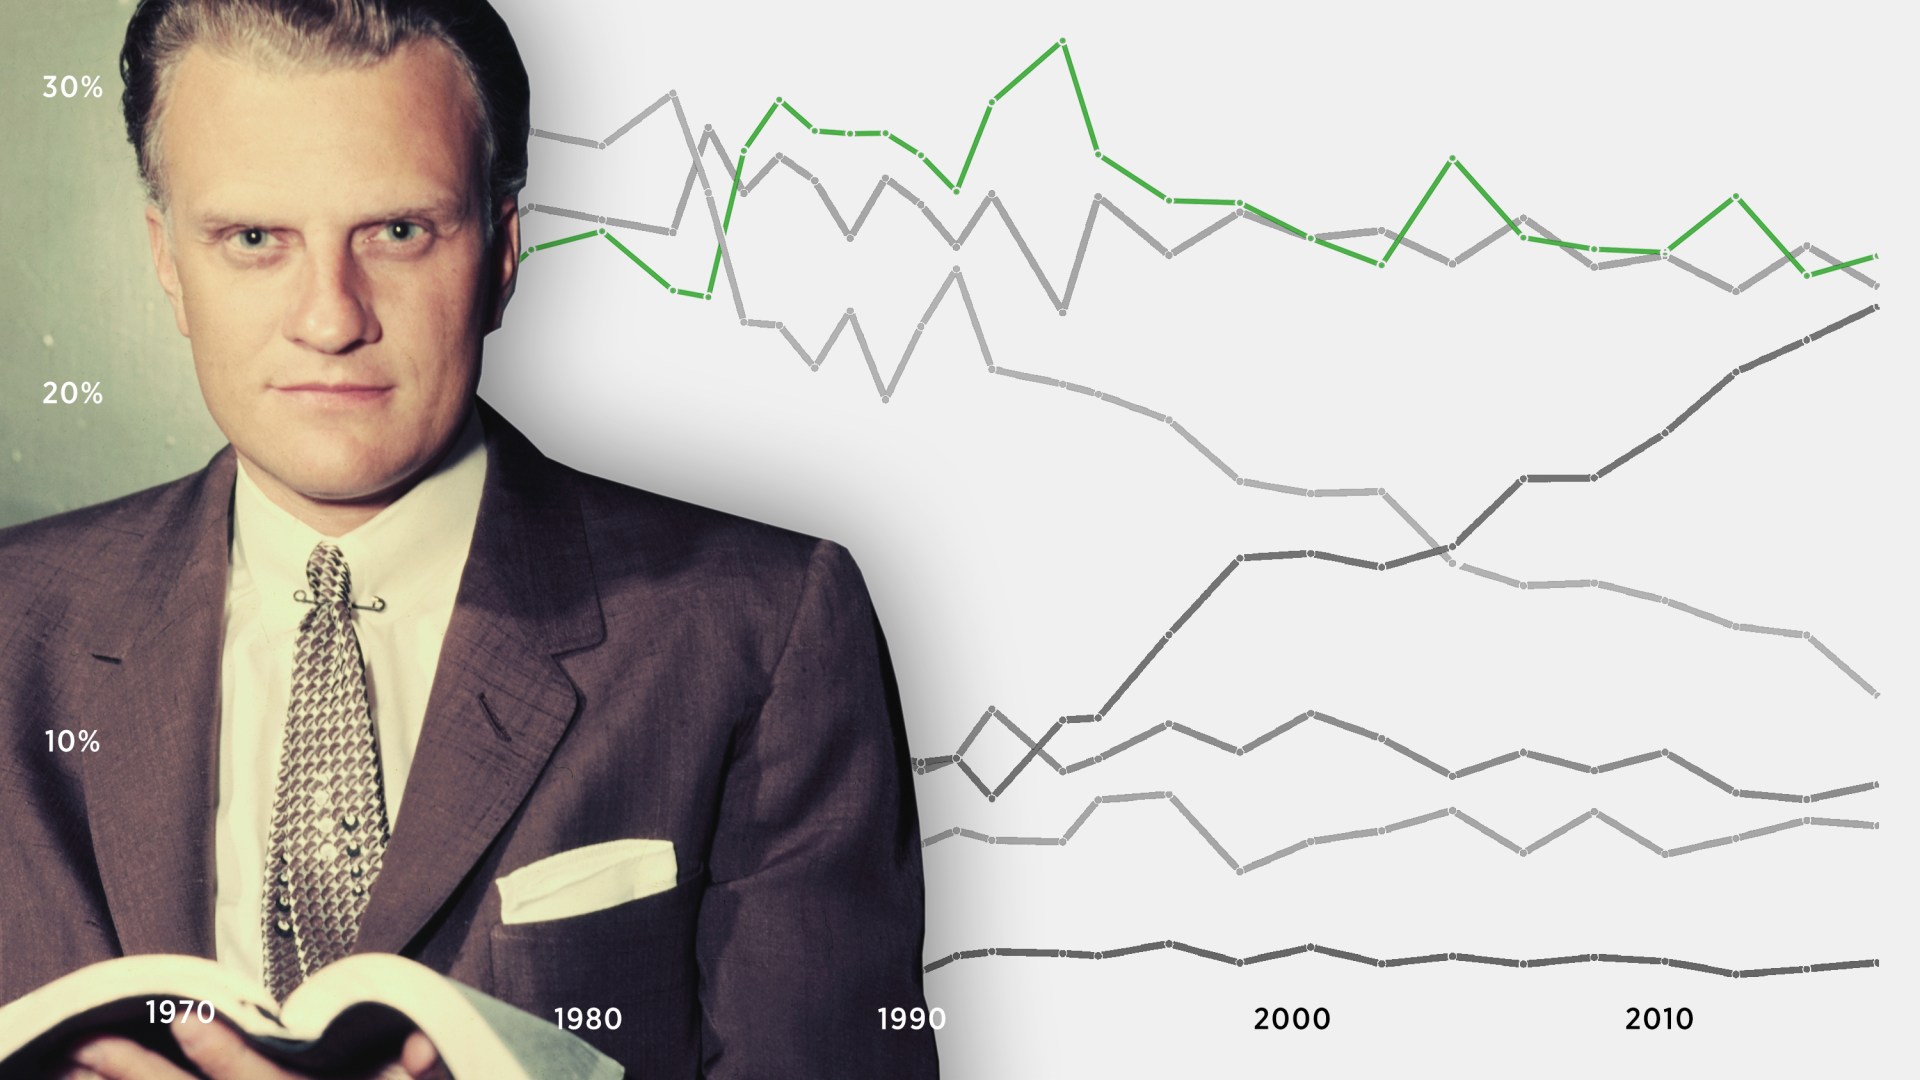
Editor’s note: In 2014, CT reported how a massive survey by the Pew Research Center found that American evangelicals were weathering the “rise of the nones” much better than other Christian groups. Today, as Billy Graham’s funeral takes place, an analysis of social science data shows the movement the 99-year-old evangelist embodied remains surprisingly strong.
The religious landscape is a volatile one, with nearly 1 in 5 Americans switching their religious tradition from 2010 to 2014.
We’ve previously examined how Protestants and Catholics changed churches, as well as which segment of the religiously unaffiliated returned to church most, during that four-year window examined by the Cooperative Congressional Election Study (CCES).
However, what happens when the time period under study is expanded, from four years to more than four decades? Are evangelicals managing to hold on to their share of the US population? Have those with no religion made significant gains? And what is causing the shifts?
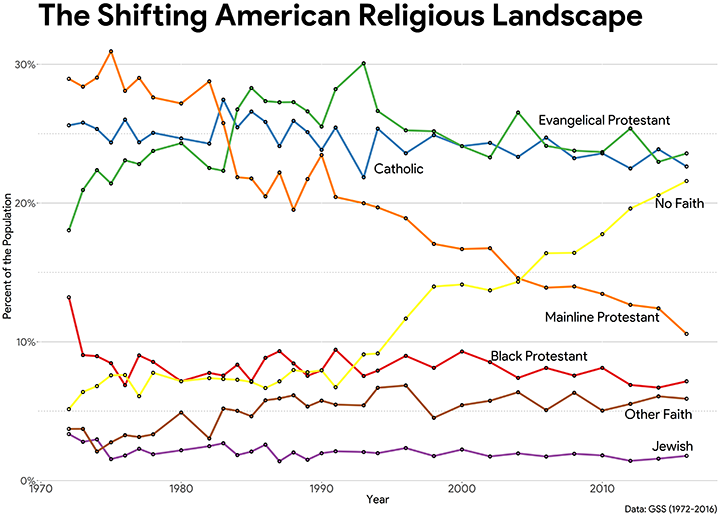
The General Social Survey (GSS) has tracked religious affiliation biannually, beginning in 1972. It provides an unmatched summation of a generation of religious movement. The visualization below, which displays the distribution of seven major religious traditions, tells a compelling story.

For smaller groups, the movement is relatively minor. Since the early 1980s, the Jewish share dropped by about a single point; black Protestants stayed relatively stable; and those with “other faith” remained about 6 percent of the US population.
Similarly, evangelicals and Catholics have almost the same proportions of the population as they had back in 1972. While evangelicals saw a surge in the early 1990s, that number has essentially stabilized to where it is today (23.6% in 2016). The Catholic share, which was reliably 23 percent to 25 percent in the 1990s, has dipped recently to 22.6 percent. That’s about a 2 percent drop in total share, which is largely in line with the findings from the Pew Research Center’s massive Religious Landscape Survey (RLS) from 2007 to 2014.
The biggest, and likely the most important, story in modern American religion is occurring among the two remaining groups: mainline Protestants and those of no faith (often referred to as the “nones”).
The shift here is dramatic and unmistakable. In the 1970s, mainline Protestants made up the largest share of Americans (about 30%). From that point, the drop has been precipitous and unabating. By 1986, mainline Protestants made up less than 20 percent of the population. In 2016, the number stands at 10.6 percent—half of what it was in 1991.
On the other hand, the number of nones has exploded. In 1972, 5.1 percent of Americans indicated they had no faith. Today, that number stands at 21.6 percent—a four-fold increase. Other researchers have noticed the same trend—Pew’s RLS found that the nones increased their share by 6.7 percent from 2007 to 2014; the GSS indicates that 5.2 percent of Americans became nones from 2006 to 2016.
The nones are rising quickly. And a lot of that gain is coming from moderate Protestants.
But why are mainline Protestants hemorrhaging so many members, while evangelicals are not?
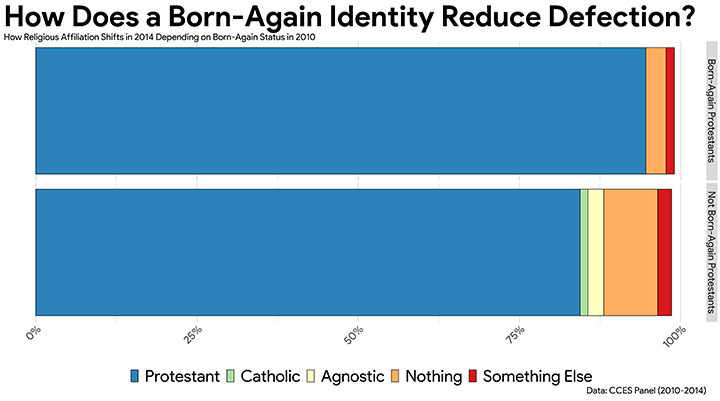
The graph above tracks how individuals changed their religious affiliation over the CCES’s four-year window. The survey asked respondents if they would describe themselves as “born again” in 2010, 2012, and 2014.
The total share of the US population that indicated they were born again did not change: 26 percent in 2010, compared to 26.1 percent in 2014. Of those who said they were born again in 2010, 94.6 percent were still Protestants in 2014 while just 3.3 percent became a none.
On the other hand, of Protestants who said they were not born again in 2010, 15.6 percent had left Protestantism by 2014. Of that group, nearly two-thirds had become nones by 2014.
Consider this: Of Protestants who indicated that they were born again in 2010, just 3.3 percent became nones in 2014. Of those who declared that they were atheists in 2010, just 3.1 percent switched to a theistic religion in 2014. This indicates each end of the American religious spectrum is incredibly stable, with very little defection.
Of Americans who became born-again Christians between 2010 and 2014, only 18.4 percent came from the nones. All of those said they were previously “nothing in particular,” meaning not a single self-identified atheist or agnostic in the entire sample had a born-again experience between 2010 and 2014.
What about migration away from born-again Christianity? Of Americans who moved from born again in 2010 to not born again in 2014, 26 percent became a none. This indicates a significant number of individuals who renounced a born-again status did not take a small step away (i.e., becoming mainline Protestant); instead, they moved toward no religion at all.
This deserves some closer scrutiny.
When evangelical churches grow, are they bringing in those who were religiously unaffiliated? Or do they usually gain membership from other Christian churches?
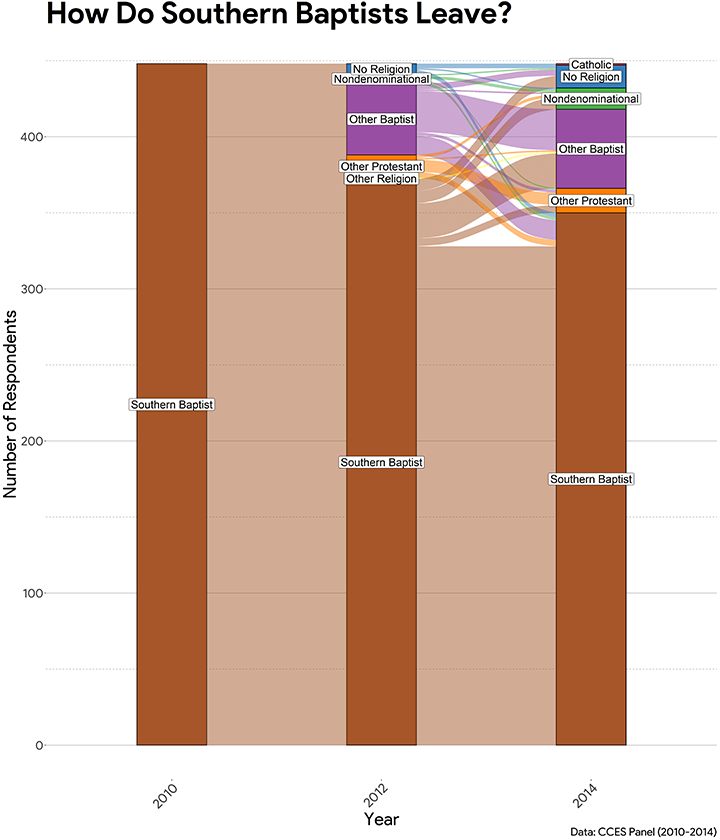
I chose the Southern Baptist Convention (SBC), America’s largest Protestant denomination, as a test case, and observed the migration patterns both into and out of the SBC over the CCES’s four-year time period. The first graph below displays all those in the sample who indicated a Southern Baptist affiliation in 2010, and how those individuals moved about the religious landscape in 2012 and 2014.

The general impression from this data is that very few Southern Baptists leave Protestant Christianity, even if they leave their SBC church.
While 77.2 percent of Americans affiliating with the SBC in 2010 are still affiliating in 2014, approximately 20 percent left the SBC for another Baptist denomination, a nondenominational church, or another Protestant tradition. In fact, just 3.3 percent of all Southern Baptists in 2010 indicated that they had no religion in 2014.
It’s also instructive to see where the SBC is effectively recruiting new members. The results below look a lot like the previous graph that visualized who migrated out of the SBC tradition.
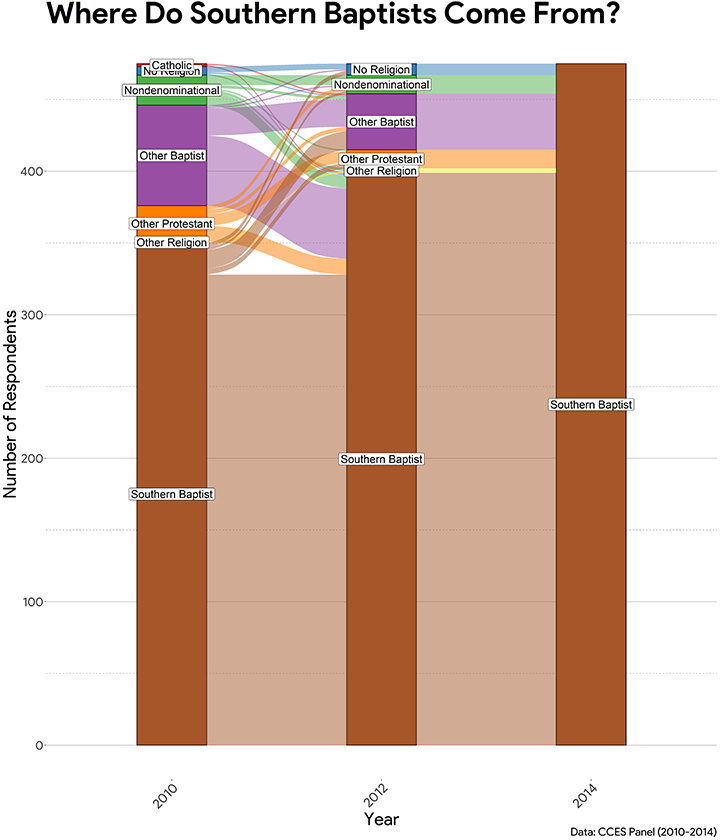
Of all the Southern Baptists in 2014, 96.5 percent of them were some type of Protestant in 2010. This means that SBC churches were able to increase their membership by 3.5 percent through recruiting nones.
But since 3.3 percent of Southern Baptists in 2010 reported they had left religion by 2014, net migration between Southern Baptists and the nones was effectively zero. For every none who became a Southern Baptist, a Southern Baptist became a none.
This migration pattern could be a significant reason why evangelicals’ population share has not decreased: They have been able to offset their losses by making small gains in membership.
Meanwhile, mainline Protestants have not been so effective. Between 2010 and 2014, 8.5 percent of mainline Protestants became nones, while just 4.4 percent of nones became mainline Protestants. Said another way, mainline Protestants lost two members for every one they gained from the none column between 2010 and 2014.
The reasons for the overall movement away from mainline Protestantism are incredibly complicated, from the average age of the tradition to birth rates and immigration. In 2002, social scientists Michael Hout and Charles Fischer argued that a large part of the movement toward unaffiliation was that many moderate Christians were disillusioned by the emergence of the Religious Right, with many abandoning religion entirely in protest. There is some general evidence of that in the data.
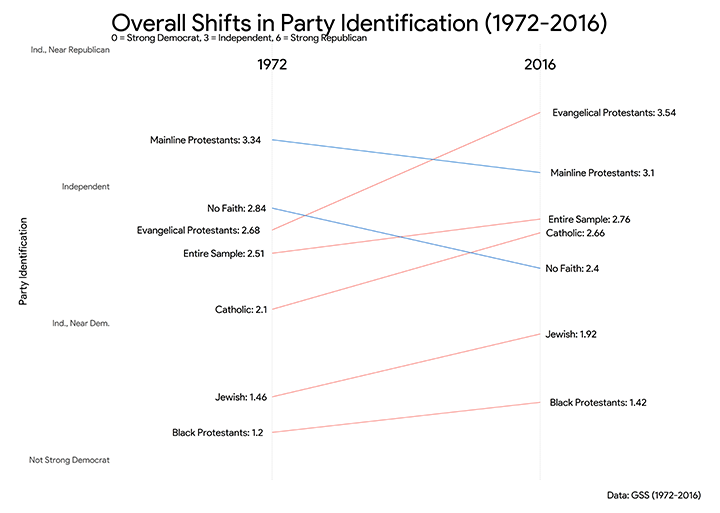
The GSS asked respondents about their party identification on a scale from 0 (strong Democrat) to 6 (strong Republican). I calculated the average party identification for each religious tradition in both 1972 and 2016.
The entire sample trended to the right about one quarter of one point, which means that Americans became about 5 percent more Republican in the 44 years under study.
In comparison to that baseline, the movement of evangelicals is dramatic. The average evangelical became 14 percent more Republican—three times more movement to the right than the average American.
In contrast, both the mainline Protestants and those of no faith became more liberal. It is staggering to note that in 1972, both mainline Protestants and those of no faith were more conservative than evangelicals.
That is no longer the case. In fact, these two groups have moved in the opposite direction of the overarching trend. One possible explanation is that conservative mainliners left to become evangelicals, while religious nones have continued to tack to the left to provide a counterbalance to the increasing conservatism of evangelicals.
Partisan polarization has been the most distinct feature of American politics over the last several decades. It is not a large theoretical leap to believe that this bifurcation of the electorate has permeated into the religious choices of Americans. Work by Paul Djupe, Jake Neiheisel, and Anand Sokhey using panel data found that those who disagreed with the Religious Right were more likely to leave their churches.
Thus, it seems that in some ways, religion is becoming increasingly like politics: a stable and activated contingent on each side of the spectrum, with a good deal of Americans left in the middle. It seems that in both religion and politics, moderates have been set adrift with no clear place for them to find a home.
Ryan P. Burge is an instructor of political science at Eastern Illinois University. His research appears on the site Religion in Public.