
In this series


Once again, you can follow in real time what Twitter users say they are giving up for Lent, which this year begins on Wednesday, February 14.
Last year, food items were three times as popular to abstain from as technology items or personal habits, according to 73,334 tweets analyzed by OpenBible.info’s Stephen Smith during the week of Ash Wednesday 2017. Alcohol ranked No. 1 for the first time since his project began in 2009.
This year, the creator of the Twitter Lent Tracker “expected relationship-related tweets to run higher than usual” because Ash Wednesday coincides with Valentine’s Day. (Also, Easter coincides with April Fools’ Day.)
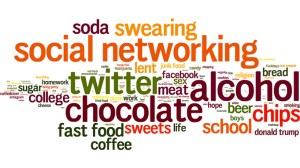
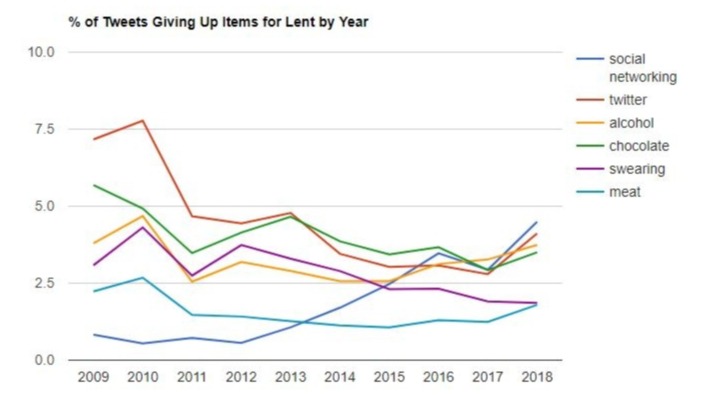
“Social networking topped the [2018] list, followed by Twitter, alcohol, chocolate, and swearing,” wrote Smith in his final analysis, based on 29,609 tweets (excluding retweets). “It was a fairly typical year, with the top 5 the same as last year (though in a different order) except for swearing, which came in at No. 6 last year, behind chips.”
Here is how the top 6 ideas of 2018 have trended over time:
 OpenBible.info
Smith was most curious last year about how high Donald Trump would rank among perennial favorites such as social networking, alcohol, and chocolate. The President ended up finishing No. 22 in 2017, up from No. 82 in 2016. In 2018, he finished No. 67.
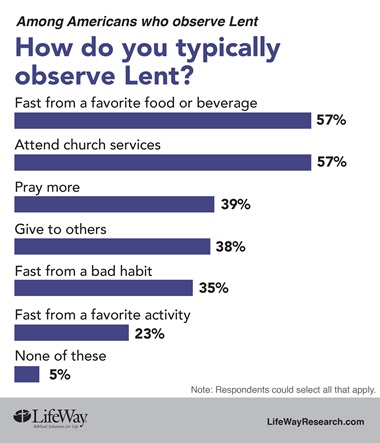 Image processed by CodeCarvings Piczard ### FREE Community Edition ### on 2017-02-15 15:55:24Z | http://piczard.com | http://codecarvings.com
Meanwhile, LifeWay Research offered a chance to compare Twitter’s serious vs. sarcastic sharers last year via its study on what Americans who observe the Lenten season before Easter say they actually give up.
Of note: 3 in 10 Americans with evangelical beliefs (28%) say they observe Lent; of these, 42 percent typically fast from a favorite food or beverage while 71 percent typically attend church services.
Catholics remain the most likely to observe Lent (61%), with 2 out of 3 fasting from a favorite food or beverage (64%).
Overall, 1 in 4 Americans observes Lent (24%), according to LifeWay. Most American observers fast from a favorite food or beverage (57%) vs. a bad habit (35%) or a favorite activity (23%).
Hispanics were the most likely ethnic group to observe Lent (36%), and were more likely than whites to abstain from a favorite activity (34% vs. 17%) or a bad habit (50% vs. 30%).
In 2014, Barna Group found that 17 percent of US adults planned to fast during Lent, including 63 percent of practicing Catholics and 16 percent of practicing Protestants. Most were giving up a food item, including chocolate (30%), meat (28%), soda (26%), or alcohol (24%).
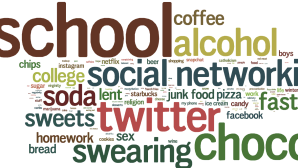
Twitter’s top five Lenten choices have proven consistently popular since Smith began tracking Lent in 2009. In the list below of the final top 100 ideas of 2018, each link will show how that particular idea has trended over time.
For comparison, here are the top 100 ideas of 2017, 2016, 2015, and 2014, as well as a word cloud of the top ideas of 2018:
 Stephen Smith / OpenBible.info
CT regularly reports on Lent, including three views on why bother celebrating Lent, the best books to read for Lent, Lent in Narnia, and the argument for lengthening Lent. CT editor-in-chief Mark Galli offered his thoughts on “giving up self discipline” for Lent.
Below is Smith’s final tally of the top 100 most-mentioned Lenten sacrifices (both serious and cynical) in 2018. (This list covers all tweets from February 11–17 that mention giving up something for Lent and, except as noted, excludes retweets.)
Top 100 Things Twitter Gave Up for Lent (based on 29,609 tweets)
| Rank | Word | Count | Change from last year’s rank |
|---|---|---|---|
| 1. | Social networking | 1,329 | +1 |
| 2. | 1,215 | +2 | |
| 3. | Alcohol | 1,105 | -2 |
| 4. | Chocolate | 1,035 | -1 |
| 5. | Swearing | 549 | +1 |
| 6. | Meat | 531 | +6 |
| 7. | Sweets | 499 | +3 |
| 8. | Soda | 441 | 0 |
| 9. | Coffee | 387 | +2 |
| 10. | Fast food | 380 | -1 |
| 11. | Lent | 373 | +2 |
| 12. | 342 | +9 | |
| 13. | Sex | 315 | +6 |
| 14. | Bread | 267 | +2 |
| 15. | School | 256 | -8 |
| 16. | Chips | 222 | -11 |
| 17. | Snapchat | 216 | +34 |
| 18. | Beer | 193 | -3 |
| 19. | You | 189 | +1 |
| 20. | Men | 189 | +35 |
| 21. | Plastic | 188 | +122 |
| 22. | Sugar | 185 | -5 |
| 23. | Boys | 165 | +2 |
| 24. | Candy | 162 | +7 |
| 25. | Valentine’s Day | 157 | +130 |
| 26. | Work | 145 | -2 |
| 27. | College | 145 | -13 |
| 28. | Negativity | 144 | +32 |
| 29. | 143 | +13 | |
| 30. | Guns | 141 | +126 |
| 31. | Life | 139 | -13 |
| 32. | Marijuana | 132 | +1 |
| 33. | Junk food | 130 | -6 |
| 34. | Religion | 130 | -8 |
| 35. | Giving up things | 112 | |
| 36. | Starbucks | 111 | -2 |
| 37. | Red meat | 108 | +12 |
| 38. | Cheese | 106 | -6 |
| 39. | Catholicism | 105 | -4 |
| 40. | Pizza | 104 | -11 |
| 41. | Smoking | 100 | -11 |
| 42. | Love | 100 | +96 |
| 43. | Wine | 93 | -3 |
| 44. | Carbs | 91 | 0 |
| 45. | Me | 89 | -7 |
| 46. | Fortnite | 87 | |
| 47. | Lying | 84 | +25 |
| 48. | Dairy | 81 | +13 |
| 49. | Homework | 78 | -21 |
| 50. | Rice | 77 | -7 |
| 51. | Booze | 76 | +12 |
| 52. | Fried food | 75 | -7 |
| 53. | Ice cream | 74 | -17 |
| 54. | Complaining | 72 | +14 |
| 55. | Cookies | 69 | -18 |
| 56. | Single use plastic | 68 | +100 |
| 57. | Shopping | 68 | -11 |
| 58. | People | 66 | -11 |
| 59. | Caffeine | 65 | +11 |
| 60. | Stuff | 60 | -10 |
| 61. | Masturbation | 59 | +3 |
| 62. | Liquor | 58 | -5 |
| 63. | F***boys | 58 | -24 |
| 64. | Takeout | 57 | -4 |
| 65. | Sobriety | 57 | -9 |
| 66. | Hope | 57 | -43 |
| 67. | Donald Trump | 56 | -46 |
| 68. | Procrastination | 56 | -13 |
| 69. | Virginity | 55 | -21 |
| 70. | McDonald’s | 55 | -8 |
| 71. | Hot Cheetos | 55 | -5 |
| 72. | French fries | 53 | -20 |
| 73. | Netflix | 53 | -8 |
| 74. | Fizzy drinks | 49 | +3 |
| 75. | Chick Fil A | 48 | +4 |
| 76. | Eating out | 48 | -10 |
| 77. | Makeup | 47 | -32 |
| 78. | Porn | 47 | +21 |
| 79. | Myself | 45 | -3 |
| 80. | Juuling | 45 | |
| 81. | Him | 44 | -7 |
| 82. | Pasta | 44 | -3 |
| 83. | Desserts | 41 | -14 |
| 84. | Food | 40 | -25 |
| 85. | Coke | 40 | -14 |
| 86. | Pork | 39 | +17 |
| 87. | Dating | 38 | +23 |
| 88. | Mass shootings | 38 | |
| 89. | Sleep | 38 | -16 |
| 90. | Breathing | 37 | -47 |
| 91. | Boba | 37 | +3 |
| 92. | Being single | 36 | +22 |
| 93. | Cake | 36 | -6 |
| 94. | My will to live | 36 | -36 |
| 95. | Pancakes | 36 | -15 |
| 96. | The presidency | 35 | -43 |
| 97. | Online shopping | 32 | -15 |
| 98. | Tea | 31 | +10 |
| 99. | Brexit | 30 | +27 |
| 100. | This | 30 | -5 |
| 101. | TV | 30 | -5 |
Top Categories
| Rank | Category | Number of Tweets |
|---|---|---|
| 1. | food | 6,702 |
| 2. | technology | 3,556 |
| 3. | habits | 2,034 |
| 4. | smoking/drugs/alcohol | 2,027 |
| 5. | relationship | 1,339 |
| 6. | irony | 946 |
| 7. | school/work | 714 |
| 8. | sex | 568 |
| 9. | religion | 404 |
| 10. | politics | 252 |
| 11. | generic | 224 |
| 12. | possessions | 155 |
| 13. | entertainment | 149 |
| 14. | shopping | 147 |
| 15. | health/hygiene | 125 |
| 16. | money | 94 |
| 17. | sports | 53 |
| 18. | weather | 21 |
| 19. | clothes | 14 |